Two public and widely known databases were used to test the
proposed method: the MIAS database [169] and the DDSM
database [67]. As shown in Appendixes ![]() and
and ![]() , whilst the latter has its density classified
using BIRADS categories, the former only uses three classes. As we
want to classify the breast in BIRADS categories, three
mammographic experts (two from the Hospital Dr. Josep Trueta of
Girona and the other one from the Norfolk and Norwich University
Hospital) have classified all the MIAS mammograms according to the
BIRADS lexicon.
, whilst the latter has its density classified
using BIRADS categories, the former only uses three classes. As we
want to classify the breast in BIRADS categories, three
mammographic experts (two from the Hospital Dr. Josep Trueta of
Girona and the other one from the Norfolk and Norwich University
Hospital) have classified all the MIAS mammograms according to the
BIRADS lexicon.
The evaluation of the automatic and manual density classification
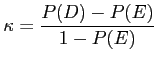
is presented in the form of confusion matrices [43]. For
each confusion matrix we include the kappa (![]() )
coefficient [34]. This is used by means of estimating
agreement in categorical data, and is computed as:
)
coefficient [34]. This is used by means of estimating
agreement in categorical data, and is computed as: