ROC analysis proceeds from the analysis of a special case of
confusion matrix when there are only two classes: the instances
can only be positive or negative.
Table ![]() shows graphically a general confusion
matrix for this special case. The entries in the confusion matrix
have the following meaning:
shows graphically a general confusion
matrix for this special case. The entries in the confusion matrix
have the following meaning:
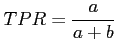
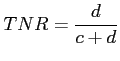
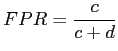
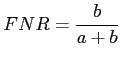
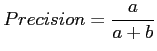
For this ![]() x
x![]() confusion matrix a set of
parameters [44] are typically extracted in order to
evaluate the result:
confusion matrix a set of
parameters [44] are typically extracted in order to
evaluate the result:
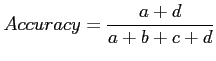 |
(C.2) |
 |
(C.3) |
 |
(C.4) |
 |
(C.5) |
 |
(C.6) |
 |
(C.7) |
A ROC graph is a plot with the false positive rate on the ![]() -axis
and the sensitivity (the true positive rate) on the
-axis
and the sensitivity (the true positive rate) on the ![]() -axis.
Thus, each axis ranges from 0
to
-axis.
Thus, each axis ranges from 0
to ![]() . The point
. The point
![]() is
the perfect classifier: it classifies all positive cases and
negative cases correctly. The point
is
the perfect classifier: it classifies all positive cases and
negative cases correctly. The point
![]() represents a
classifier that predicts all cases to be negative, while the point
represents a
classifier that predicts all cases to be negative, while the point
![]() corresponds to a classifier that predicts every case
to be positive. Point
corresponds to a classifier that predicts every case
to be positive. Point
![]() is the classifier that is
incorrect for all classifications. When no useful discrimination
is achieved the true positive rate is always equal to the false
positive rate, obtaining thus a point in the diagonal line from
point
is the classifier that is
incorrect for all classifications. When no useful discrimination
is achieved the true positive rate is always equal to the false
positive rate, obtaining thus a point in the diagonal line from
point
![]() to point
to point
![]() .
.
However, a ROC graph has more information that a single confusion matrix. In many cases, a classifier has a parameter that can be adjusted to increase true positive rate at the cost of an increased false positive rate. Therefore, each parameter setting provides a point on the graph, and varying the parameter a curve is achieved.
Figure ![]() shows an example of a ROC graph with two
ROC curves labeled
shows an example of a ROC graph with two
ROC curves labeled ![]() and
and ![]() , and the probability obtained by
chance. Curve
, and the probability obtained by
chance. Curve ![]() obtains better performance than curve
obtains better performance than curve ![]() , as
it goes closer to the point
, as
it goes closer to the point
![]() , the perfect classifier.
A measure commonly derived form a ROC curve is the area under the
curve [19], which is an indication for the overall
sensitivity and specificity of the observer, commonly called
, the perfect classifier.
A measure commonly derived form a ROC curve is the area under the
curve [19], which is an indication for the overall
sensitivity and specificity of the observer, commonly called ![]() .
As closest to the upper-left-hand corner of the graph, the area
increases until a maximum area of
.
As closest to the upper-left-hand corner of the graph, the area
increases until a maximum area of ![]() .
.
![\includegraphics[width=10 cm]{images/roc.eps}](img936.png)