Breast density
Mammographic density has been established as biomarker for breast cancer diagnosis, although it has not been fully incorporated in the risk prediction models used for risk stratification in screening and/or measuring responsiveness to preventive approaches. Within our group, automatic mammographic tissue segmentation and classification methods have been developed for estimation of breast tissue composition to facilitate mammographic risk assessment.
Breast density classification
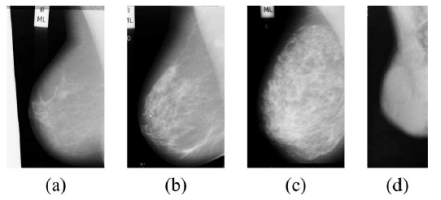
The American College of Radiology BIRADS [11] is becoming a standard on the assessment of mammographic images, which are classified in four categories according to their density.
- BIRADS I: the breast is almost entirely fatty (a).
- BIRADS II: there is some fibroglandular tissue (b).
- BIRADS III: the breast is heterogeneously dense (c).
- BIRADS IV: the breast is extremely dense (d).
We developed an approach to automatic breast tissue classification. The initial step of the proposed methodology is the segmentation of the dense tissue region (as opposed to the region containing fatty tissue) in mammographic images, which is based on a two-class fuzzy C-means clustering approach. In the second step, morphological and texture features are extracted from the dense and fatty mammographic regions. The concatenation of the features from both regions forms a high-dimensional feature space. Dimensionality reduction and classification are achieved in the subsequent step, which relies on the combination of a number of distinct classifiers.
Breast density segmentation
A quantitative segmentation of the breast into fatty and dense tissues provides more information at the local level than breast classification; nonetheless, manual breast density segmentation is difficult, time consuming, and prone to inter/intra-rater subjectivity. We developed an approach for breast density segmentation based on a supervised pixel-based classification and using textural and morphological features.
The objective of the paper is not only to show the feasibility of an automatic algorithm for breast density segmentation but also to prove its potential application to the study of breast density evolution in longitudinal studies. The database used here contains 3 complete screening examinations, acquired two years apart, of 130 different patients. The approach was validated by comparing manual expert annotations with automatically obtained estimations. Transversal analysis of the breast density analysis of CC and MLO views of both breasts acquired in the same study showed a correlation coefficient of r=0.96 between the mammographic density percentage for left and right breasts, whereas a comparison of both mammographic views showed a correlation of r=0.95. A longitudinal study of breast density confirmed the trend that dense tissue percentage decreases over time, although we noticed that the decrease in the ratio depends on the initial amount of breast density.