A summary of my research on breast imaging since 2003, with colleagues at the University of Girona and elsewhere, gathered here as pointers and resources for researchers in the field. Each topic links to the related papers and, where available, to annotations you can request to benchmark your own methods.
Pre-processing
Peripheral enhancement
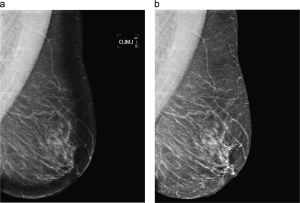
Digital mammograms may show an overexposed area in the periphery of the breast, darker and with lower contrast, which hampers visual and automatic assessment. We proposed a method that restores this area by equalising it with the intensity of non-overexposed neighbouring pixels, using a multiplicative model and the distance map from the breast boundary. The enhancement helps uncover abnormalities in the peripheral zone and benefits CAD and density measurement systems.
Breast profile segmentation
Separating the breast from the background and the pectoral muscle is a key step for density measurement, registration and lesion detection. Instead of two separate strategies, we solved it jointly with a supervised approach that models breast, pectoral muscle and background using position, intensity and texture. On 149 MIAS mammograms the results overlapped highly with manual segmentation.
Data. Manual segmentation of the whole MIAS database into breast, pectoral muscle and background.
Breast density
Mammographic density is an established biomarker of breast cancer risk. We developed methods to segment and classify breast tissue to support risk assessment.
Density classification
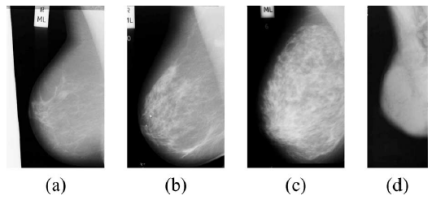
Following the four BI-RADS density categories, our approach first segments dense versus fatty tissue with two-class fuzzy C-means, then extracts morphological and texture features from both regions, and finally reduces dimensionality and classifies with a combination of classifiers.
Density segmentation
A supervised pixel-based classification with texture and morphological features gives a local, quantitative map of dense tissue. On three screening rounds of 130 women, left and right breasts correlated at r = 0.96 and CC and MLO views at r = 0.95, and the longitudinal analysis confirmed that dense tissue decreases over time, at a rate that depends on the initial density.
Data. BI-RADS density classification of the whole MIAS database.
Mass detection
A breast mass is one of the clearest signs of breast cancer, yet radiologists can miss masses at the edge of glandular tissue, hidden by overlapping tissue or visible in only one view.
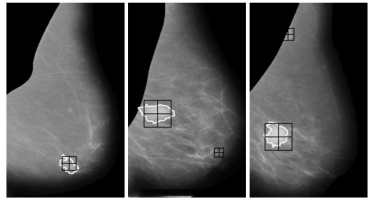
We developed a supervised algorithm using contour and shape information: a probabilistic template-matching approach whose templates come from the analysis of real mass shapes. Suspicious regions are then classified as mass or normal tissue by a false positive reduction step based on two-dimensional PCA. Unlike most previous work, the method takes breast density (BI-RADS) into account, since both radiologists and commercial CAD systems perform worse in dense breasts.
False positive reduction
We proposed several approaches to reduce false positives in mass detection using the texture of the masses. We studied PCA and Local Binary Patterns to describe micro-patterns (edges, lines, spots, flat areas) while preserving the spatial structure of the mass. Ours were the first works using LBP for mammographic mass detection: LBP features with Support Vector Machines improved false positive reduction.
Data. The dataset used in our false positive reduction experiments.
If you use it, please cite: X. Lladó, A. Oliver, J. Freixenet, R. Martí and J. Martí. A textural approach for mass false positive reduction in mammography. Computerized Medical Imaging and Graphics, 33(6), 415–422, 2009.
Microcalcifications
Calcifications are calcium deposits in breast tissue that mammography can reveal long before a lump develops, one of the reasons for screening programmes.
Our method learns the morphology of individual microcalcifications from local image features and trains a pixel-based boosting classifier that, at each round, selects the most salient feature. On a new mammogram only these features are computed to classify each pixel. Clusters are then found by inspecting the neighbourhood of each detected microcalcification.
Data. Manual annotations of individual microcalcifications in the MIAS database.
If you use it, please cite: A. Oliver, A. Torrent, X. Lladó, M. Tortajada, L. Tortajada, M. Sentís, J. Freixenet and R. Zwiggelaar. Automatic microcalcification and cluster detection in digital and digitised mammograms. Knowledge-Based Systems, 28, 68–75, 2012.
Diagnosis
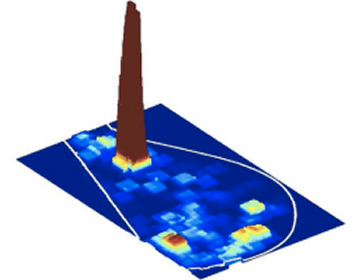
Once detected, a lesion may be benign or malignant. For microcalcification clusters we proposed a multiscale, graph-based description of their topology, instead of describing individual calcifications at a fixed scale, and used the resulting topological features to separate malignant from benign cases.
For masses, we segmented each region of interest with a region-based level set, described its shape with Zernike moments, and classified it with GentleBoost, which also gives a likelihood for the result.