As one may note from the figure the growing scheme incorporates
several parameters which need to be defined. These include a
kernel size ![]() , normal to the previous point, and a growing step
, normal to the previous point, and a growing step
![]() . Those values have been empirically determined (typical values
are
. Those values have been empirically determined (typical values
are ![]() and
and ![]() ) and kept constant trough all the
experiments.
) and kept constant trough all the
experiments.
Also from the experiments we noted that a more robust approach
should be used for the process of selecting the next candidate
point as it was often affected by noise and outliers. Instead of
evaluating only a set of normal points at a given distance and
obtain the candidate with a minimum cost over ![]() , several sets
of points on the normal are evaluated at different positions close
to the desired position of the candidate point. A set of cost
functions
, several sets
of points on the normal are evaluated at different positions close
to the desired position of the candidate point. A set of cost
functions ![]() is then obtained for each set of normal points
(where
is then obtained for each set of normal points
(where ![]() means the actual pixel and
means the actual pixel and ![]() the set of normal
points). Using this approach the candidate point will be the one
with the minimum cost over all the different sets
the set of normal
points). Using this approach the candidate point will be the one
with the minimum cost over all the different sets ![]() . One
should note that in the different cost functions, the same (or
nearly the same) point can lie in a shifted position. In order to
make those cost functions comparable the cost functions are
iteratively right and left shifted. The global minimum cost for
each point is obtained as the minimum using those shifted
functions and the original cost. Figure
. One
should note that in the different cost functions, the same (or
nearly the same) point can lie in a shifted position. In order to
make those cost functions comparable the cost functions are
iteratively right and left shifted. The global minimum cost for
each point is obtained as the minimum using those shifted
functions and the original cost. Figure
![]() shows the minimum cost function of
candidate points with and without cost shifting. Note that
transportation effects have been minimized when costs are shifted
allowing a better estimation of the minimum cost.
shows the minimum cost function of
candidate points with and without cost shifting. Note that
transportation effects have been minimized when costs are shifted
allowing a better estimation of the minimum cost.
|
Candidate points are obtained from the zero crossing points along
the normalized gradient using the scale space representation
described earlier. The cost of choosing a candidate point ![]() is
given by the following weighted function
is
given by the following weighted function ![]() which includes
gradient, intensity, contour curvature and position information.
Using this information, the contour tends to grow finding areas
of increasing intensity keeping minimal position and direction
changes.
which includes
gradient, intensity, contour curvature and position information.
Using this information, the contour tends to grow finding areas
of increasing intensity keeping minimal position and direction
changes.
The segmented breast skin-line should be continuous without having
abrupt changes. This obviously corresponds to the continuous
nature of the breast. A way to ensure this continuity is to impose
some regularization conditions to the contour growing process.
This continuity assumption might not hold in all cases (for
instance, when the nipple appears in the skin-line) but in this
case the attraction factors described earlier will be able to
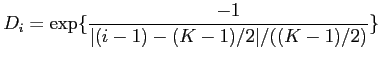
adapt the contour to those changes. The first regularization
factor ![]() biases the cost to points closer to the centre of the
kernel of size
biases the cost to points closer to the centre of the
kernel of size ![]() . This means that between two similar points the
factor will select as a better point the one with a closer
distance to the kernel centre. This factor is independent of the
image contents and is given by,
. This means that between two similar points the
factor will select as a better point the one with a closer
distance to the kernel centre. This factor is independent of the
image contents and is given by,
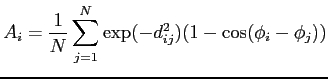
The last regularization term is defined computing the curvature
change in a local neighbourhood. Local curvature values
(directional change) at each pixel are obtained with a similar
approach as used in the work of Deschênes and
Ziou [41]. Directional change between two pixels ![]() and
and ![]() is defined by the scalar product of their normal vectors.
Hence, at a given pixel
is defined by the scalar product of their normal vectors.
Hence, at a given pixel ![]() the directional change is obtained by
computing the scalar product between
the directional change is obtained by
computing the scalar product between ![]() and its neighbouring
pixels,
and its neighbouring
pixels,
where ![]() is the angle of the normal at a pixel
is the angle of the normal at a pixel
![]() .
. ![]() is the number of points in a local neighbourhood and
is the number of points in a local neighbourhood and
![]() is the Euclidean distance between points
is the Euclidean distance between points ![]() and
and ![]() . The
distance factor is used here to weight the curvature of each point
. The
distance factor is used here to weight the curvature of each point
![]() , in order to incorporate a bias to points closer to
, in order to incorporate a bias to points closer to ![]() .
.
Figure ![]() shows an example of the
performance of this algorithm. Note that the algorithm seems to
segment far to the breast. However, if we equalize the image, the
segmentation is accurately adapted to the real mammogram border.
The main drawback of the algorithm is that in some cases there is
a poor estimation of the initial seed point, due to the large
amount of noise in the background an to the non-uniform breast
intensity distribution. In these cases, the algorithm does not
obtain what could be considered an acceptable segmentation.
shows an example of the
performance of this algorithm. Note that the algorithm seems to
segment far to the breast. However, if we equalize the image, the
segmentation is accurately adapted to the real mammogram border.
The main drawback of the algorithm is that in some cases there is
a poor estimation of the initial seed point, due to the large
amount of noise in the background an to the non-uniform breast
intensity distribution. In these cases, the algorithm does not
obtain what could be considered an acceptable segmentation.
|
![\includegraphics[height=4.5cm]{images/cuc_startingPoint.eps}](img862.png)
![\includegraphics[height=4.5cm]{images/cuc_contourGrowing.eps}](img863.png)
![\includegraphics[width=6cm]{images/cuc_robustCandidateCost.eps}](img868.png)
![\includegraphics[width=6cm]{images/cuc_robustCandidateCostTotal.eps}](img869.png)
![\includegraphics[width=3.15cm]{images/bug1.eps}](img882.png)
![\includegraphics[width=3.15cm]{images/bug1b.eps}](img883.png)
![\includegraphics[width=3.15cm]{images/bug2.eps}](img884.png)
![\includegraphics[width=3.15cm]{images/bug2b.eps}](img885.png)